Description
Why Performance Analysis?
Without the right data, you’re guessing about how to improve software performance and are unlikely to make the most effective improvements. Intel® VTune™ Profiler collects key profiling data and presents it with a powerful interface that simplifies its analysis and interpretation. Optimize software for:
- High-performance computing (HPC) in weather forecasting, finite element analysis, and bioinformatics
- Embedded applications for IoT, transportation, and manufacturing
- Media software for video transcoding and image processing
- Cloud applications or Java* services in containers
- Device drivers
- Game engines
- Storage that includes Storage Performance Development Kit (SPDK) and Data Plane Development Kit (DPDK) polled software
The Intel® VTune™ Amplifier is available as part of the Intel® oneAPI Toolkits.
Using OpenMP & Intel® VTune™ Profiler for Faster Code and Improved ROI

Our
shows the performance effect adding a single OpenMP statement to some Fortran code which is then compiled with Intel® Fortran.
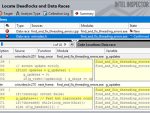
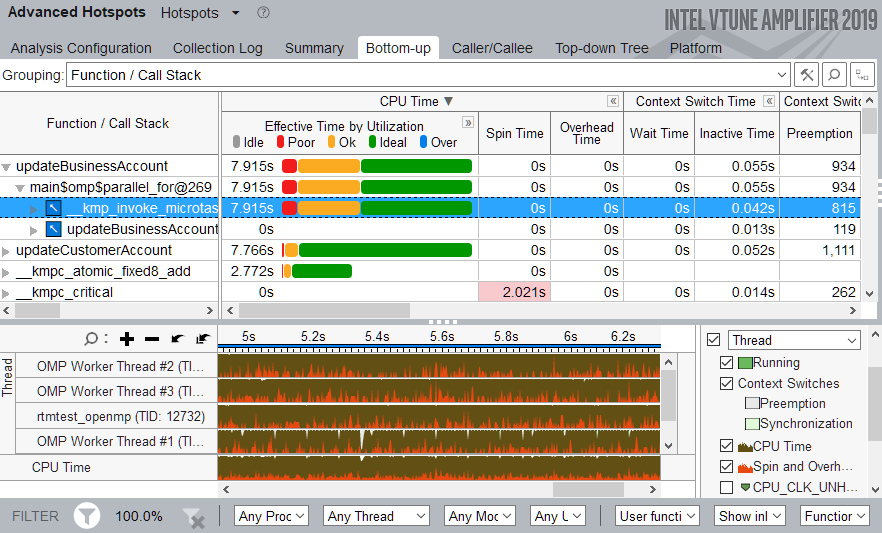
Since the example being used contains a load balance problem, Intel® VTune™ Profiler is used to analyse the performance of this demonstration program.
VTune pin-points the hot-spot that causes the imbalance.
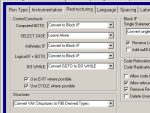
Then, after explaining the imbalance situation, it is shown how to change the OpenMP statement, so that the run-time performance of the example program is further increased.
Steps taken to improve run-time performance


Finally it is shown that the performance could be maximised by using the optimization possibilities of Intel Fortran.
The maximum speed-up on an Intel Core i7 (4 cores): 3.6 faster than the regular serialised running code.