Description
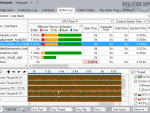
MPI Profiling for Parallel Cluster Applications
Use this graphical tool to understand MPI application behavior across its full runtime. It helps you:
- Find temporal dependencies and bottlenecks in your code
- Check the correctness of your application
- Locate potential programming errors, buffer overlaps, and deadlocks
- Visualize and understand parallel application behavior
- Evaluate profiling statistics and load balancing
- Analyze performance of subroutines or code blocks
- Learn about communication patterns, parameters, and performance data
- Identify communication hot spots
- Decrease time to solution and increase application efficiency
Intel® Trace Analyzer and Collector is part of the Intel® oneAPI HPC Toolkit.