Description
Find errors early when they are less expensive to fix. This tool locates and debugs memory and threading errors for C, C++, and Fortran applications that run on Windows and Linux.
Access a free copy that includes community forum support:
Intel® Inspector is part of the Intel® oneAPI HPC Toolkit.
Features
![]()
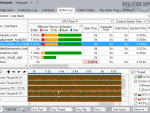
Analyze data for answers.
![]()
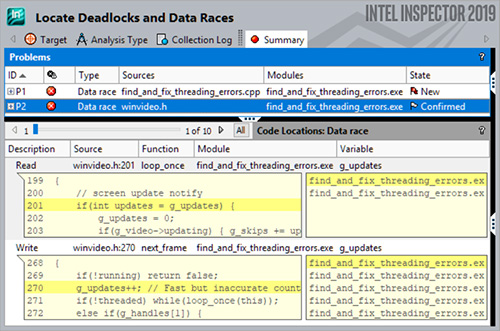
Debug hard-to-find data races and deadlocks.
![]()
Detect memory leaks, invalid accesses, and more.
![]()
Find persistence errors that include redundant cache flushes.
Solve Memory Problems Early
Memory errors and nondeterministic threading errors are difficult to find without the right tool. Intel® Inspector is designed to find these errors. It is a dynamic memory and threading error debugger for C, C++, and Fortran applications that run on Windows* and Linux* operating systems. It helps you:
- Save money: Locate the root cause of memory and threading errors before you release.
- Save time: Quickly debug intermittent races and deadlocks.
- Save data: Find errors like missing or redundant cache flushes for persistent memory implementations.
- Save effort: Use the stand-alone interface, Microsoft Visual Studio* plug-in, or command line. No special compilers or builds are required.